/Lawcode%20Logo%20(White).svg)
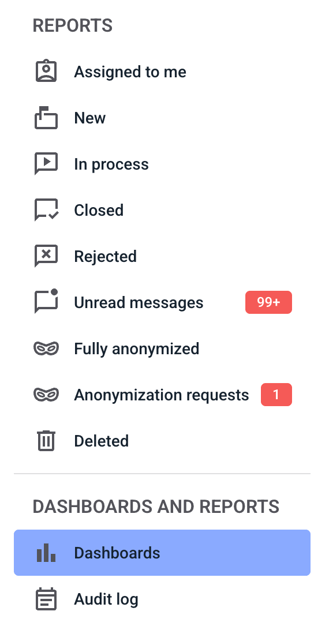
To use the map function, first click on the Dashboards.
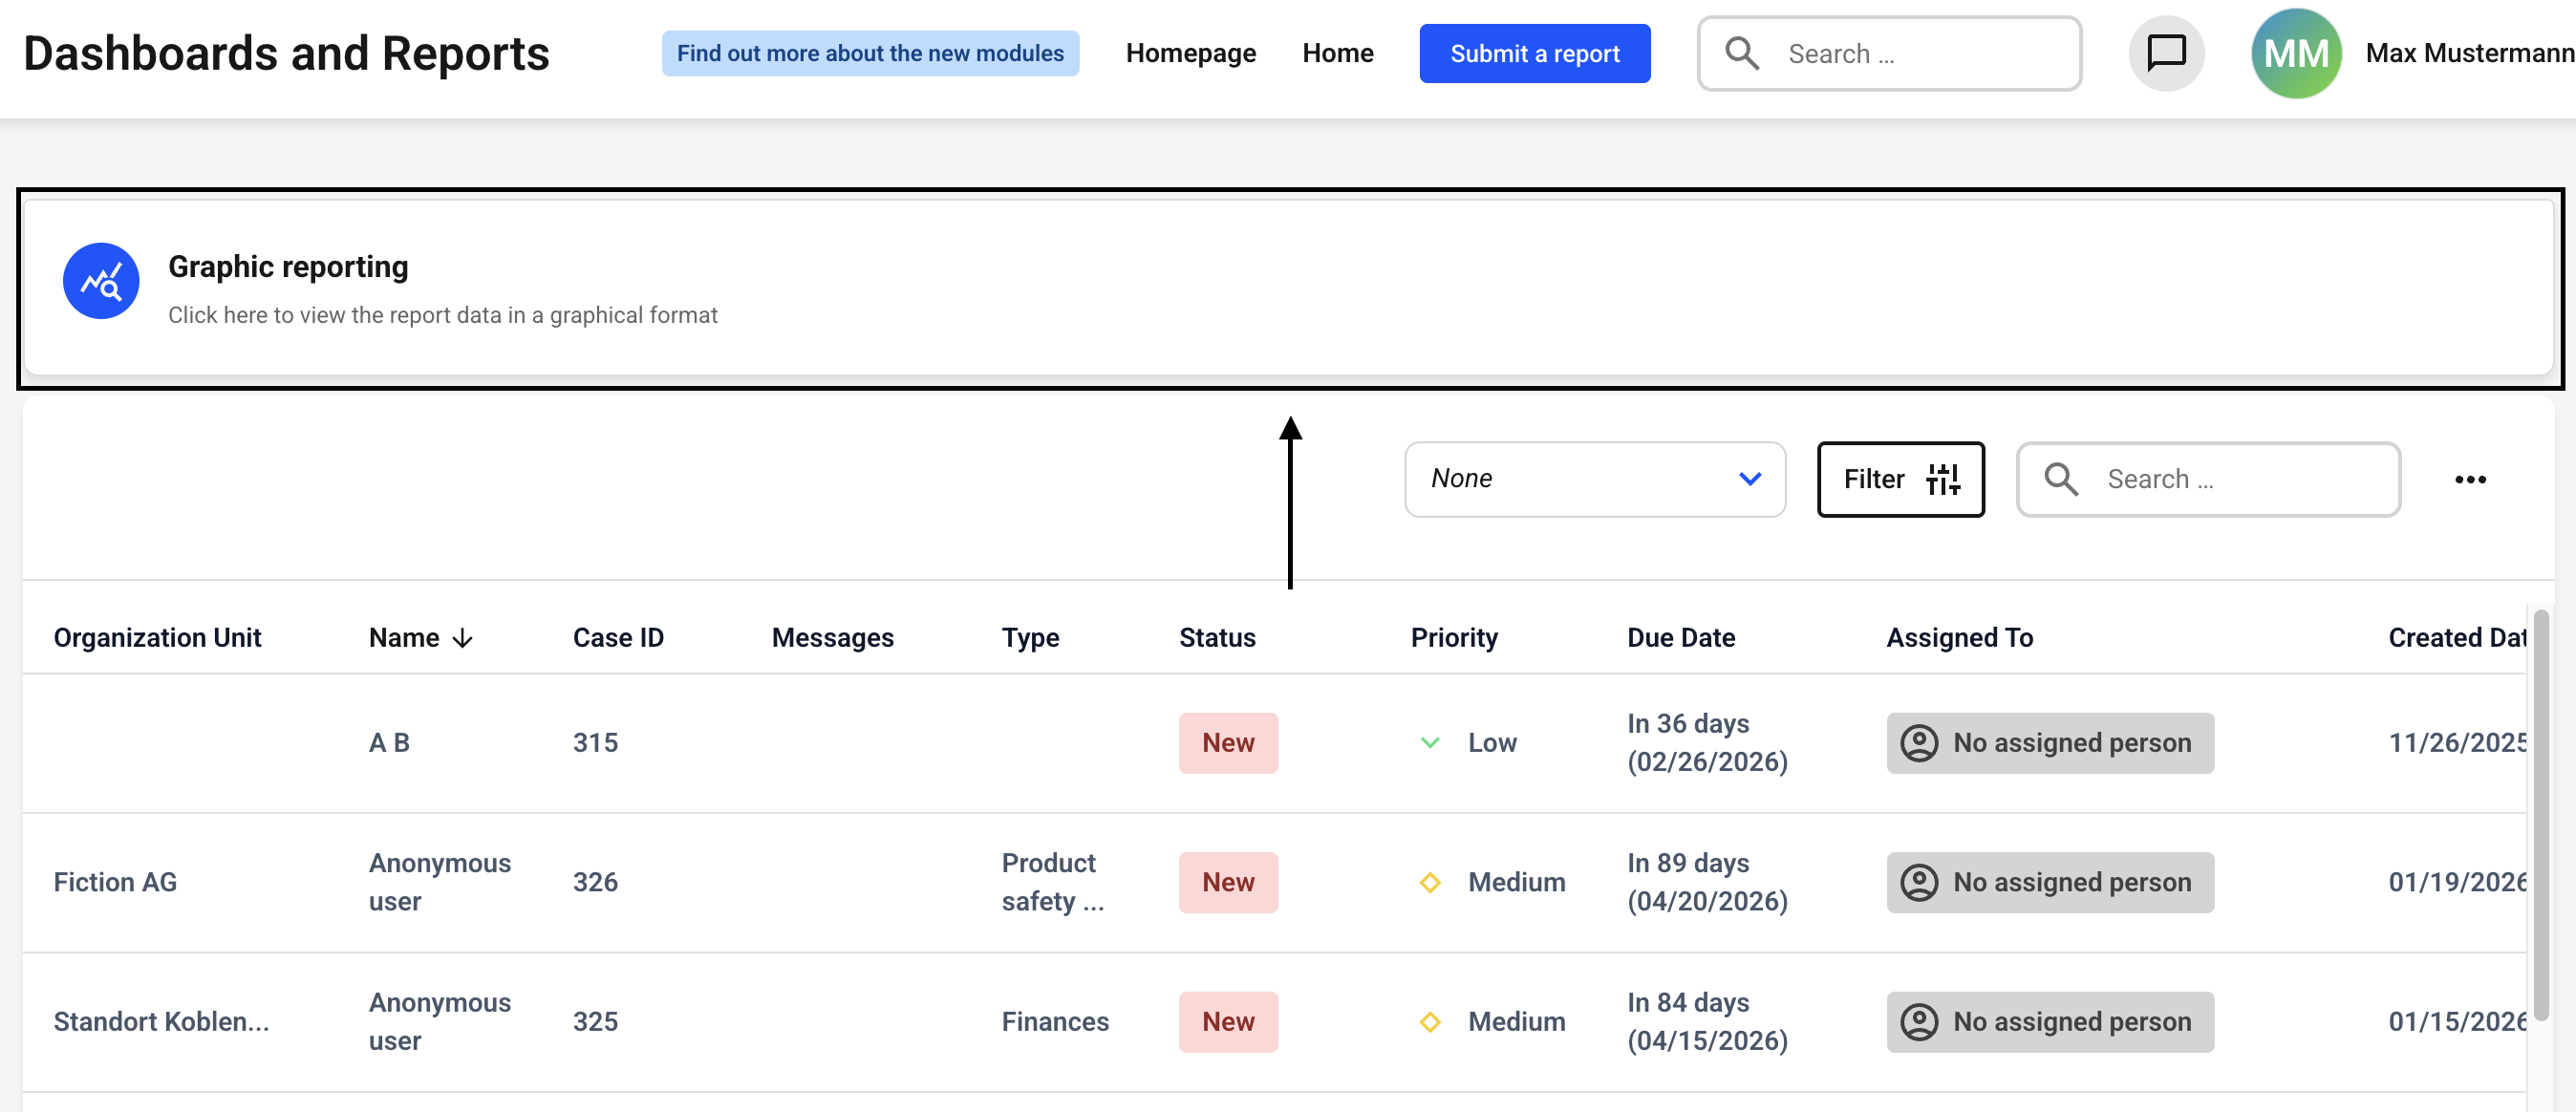
Click on Graphical reporting.
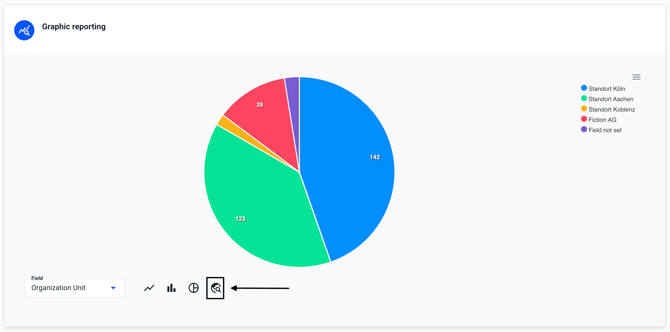
You will find the map icon in the selection below.
Important:
The results of the map function depend on the filters that are activated.
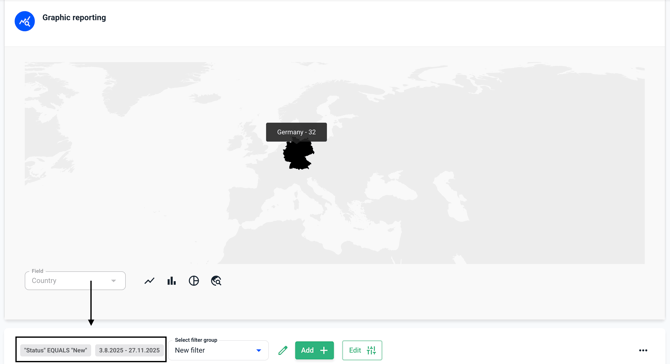
The countries from which clues have been received are marked in color.
As soon as you navigate over a marked country with the mouse, you will see how many clues have been received from that country.
Where do these values come from?
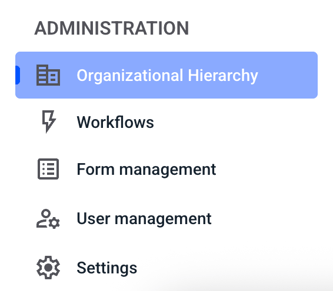
The displays are based on the countries stored in the Organizational Hierarchy.
When submitting a report, the whistleblower can select the various subsidiary affected by the report by default. Additional subsidiaries are created in the Organizational Hierarchy.
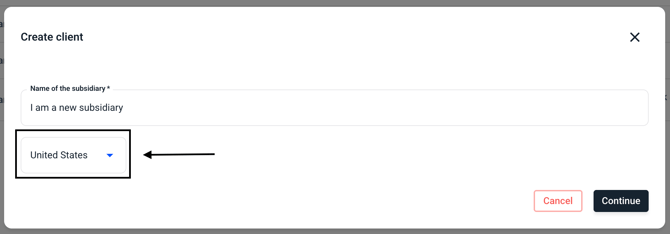
When creating a new subsidiary, you can also select the stored country (see above in the following image).
As soon as you have created the subsidiary, you can see which country the subsidiary is assigned to in the subsidiary overview.
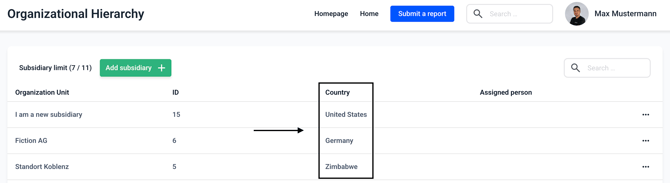
Example:
In this case, if a whistleblower selects the subsidiary ‘I am a new subsidiary’ to submit a report, the country ‘United States’ will be displayed on the map.