/Lawcode%20Logo%20(White).svg)
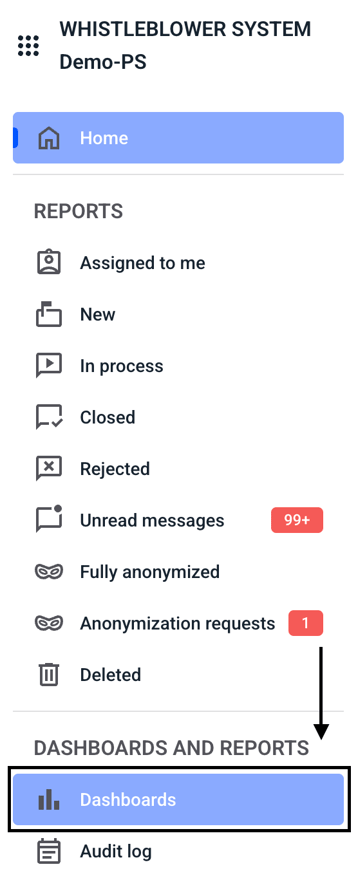
Clicking on Dashboards opens the possibility to graphically evaluate the number and type of reports.
The following view opens.

Attached is an overview of the functions. These are explained in detail later in this chapter:
You can display graphics by clicking on Graphic Reporting.

You can select your own filter groups that you have created previously.

You can create your own filter group by clicking Add.

You can view the table with the filtered values.

You can decide which columns should be displayed in the table. To do this, click on the three dots on the right-hand side.
